THE SHORT ANSWER
Where the Redding Market Stands Today
Deciding when to sell is easier when you know what buyers are facing. These five measures are the ones we watch every week. Each section that follows explains one of them in plain language, shows what it means for a seller, and gives it a simple rating.
| # | Indicator | Now | A year ago | Signal |
|---|---|---|---|---|
| 1 | Mortgage rates (30-yr) | 7.40% | about 6.3% | HEADWIND FOR SELLERS |
| 2 | Months of supply | 3.3 months | 3.9 months | FAVORS SELLERS |
| 3 | Average days on market | 78 days | 80 days | NEUTRAL |
| 4 | Sold vs. original list price | 96.1% | 95.0% | FAVORS SELLERS |
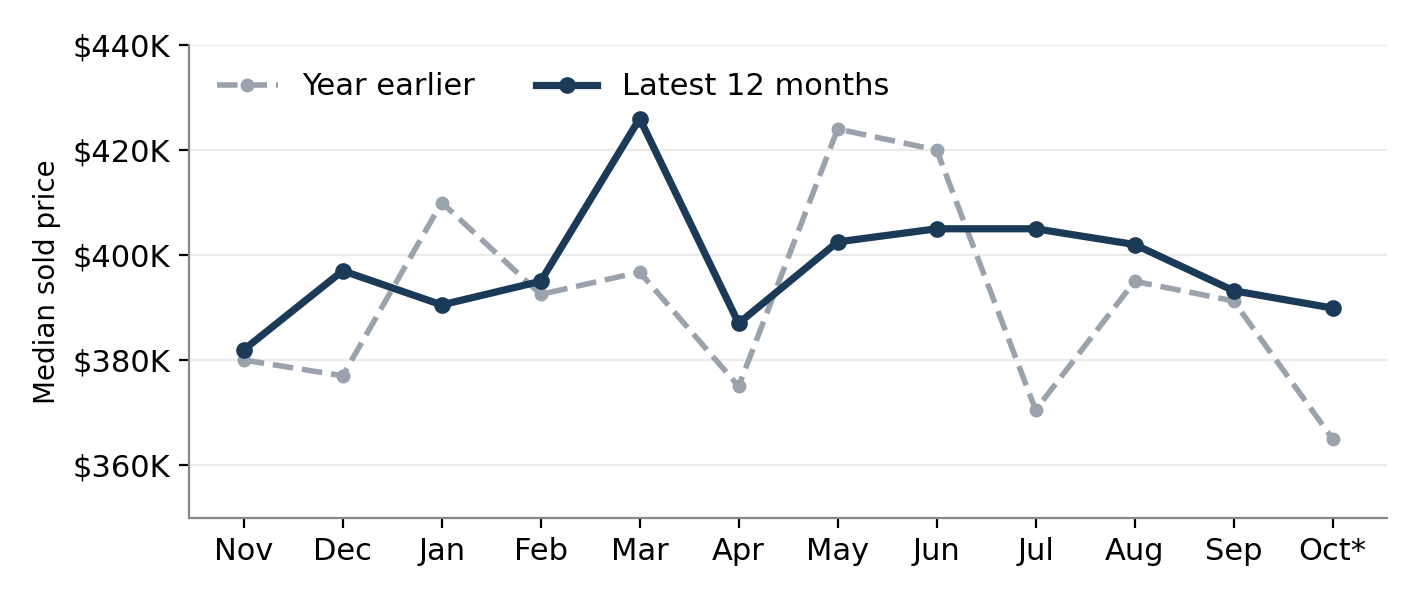
| 5 | Median sold price (Sept) | $393,200 | $391,250 | NEUTRAL |
Oct. figures are month-to-date through Oct. 23. Mortgage rate is the Freddie Mac weekly average as of Oct. 15, 2026.
Our Read
Conditions are still favorable for a home that is priced right, but the biggest swing factor is moving against sellers. Fewer homes are competing for buyers than a year ago, and sold prices are holding steady. At the same time, the average 30-year mortgage rate has jumped to its highest level since early 2025, which shrinks the pool of buyers who can afford a given home.
Nobody can predict where rates go next. What we can say is that a seller who prices accurately and prepares well today is positioned better than one who waits and hopes for a stronger market. Winter is also the slowest season in Redding, which we cover under Indicator 3.
How to read the ratings
FAVORS SELLERS means the measure helps you. NEUTRAL means it is steady. HEADWIND means it makes selling harder. No single measure decides it. Look at all five together, then add your own situation below.
This guide covers single-family and other residential listings within the city of Redding, California, using Multiple Listing Service data for the 12 months ending October 2026 compared with the same 12 months a year earlier.
INDICATOR 1 OF 5
Mortgage Rates: What Buyers Pay Each Month
Original chart from the guide
What is happening
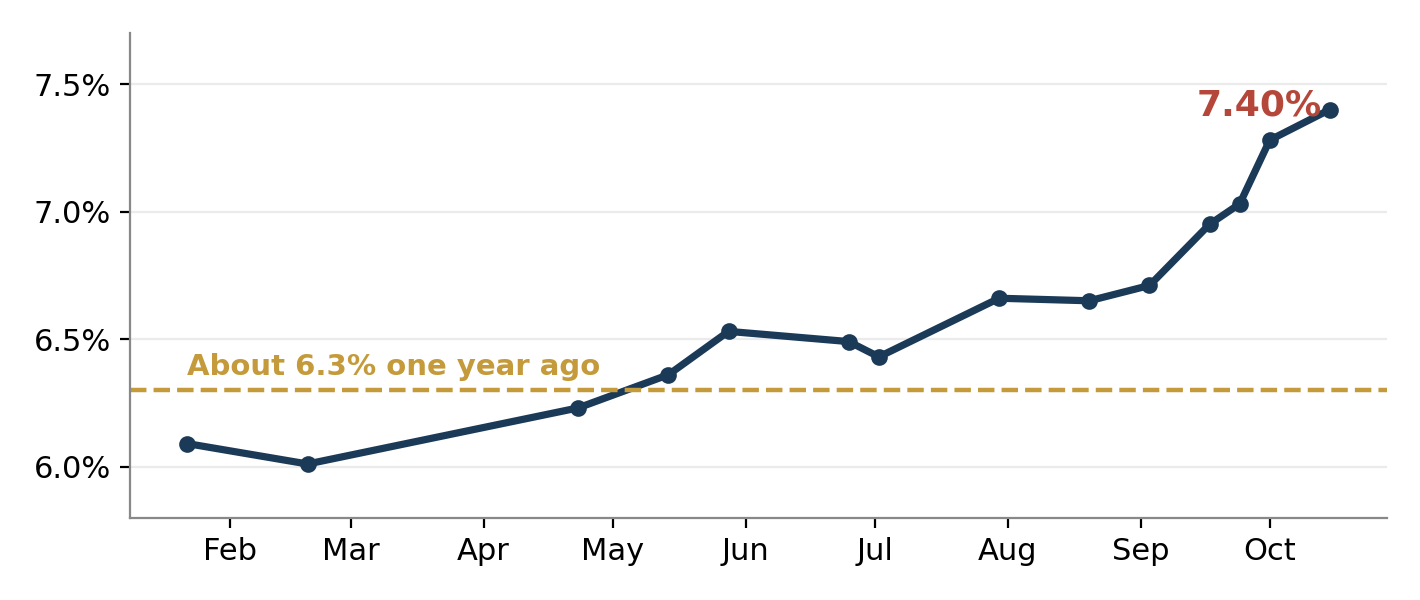
The average 30-year rate has climbed from about 6.0% in February to 7.40% in mid-October. On a $450,000 home (close to Redding's median asking price right now) with 20% down, the monthly principal-and-interest payment is about $2,230 at last year's rate and about $2,490 today. Put another way, the same monthly payment now buys roughly $48,000 less house.
There is an early sign that buyers are feeling it. Redding homes going under contract fell to 87 in September from 130 a year earlier, down about 33%.
What it means for you
Higher rates mean fewer qualified buyers and more price-sensitive ones. If you are thinking of selling, it is reasonable not to count on next spring being better. Rates can also fall, so we help you weigh your own timing rather than guess.
INDICATOR 2 OF 5
Inventory: Homes Competing With Yours
Original chart from the guide
What is happening
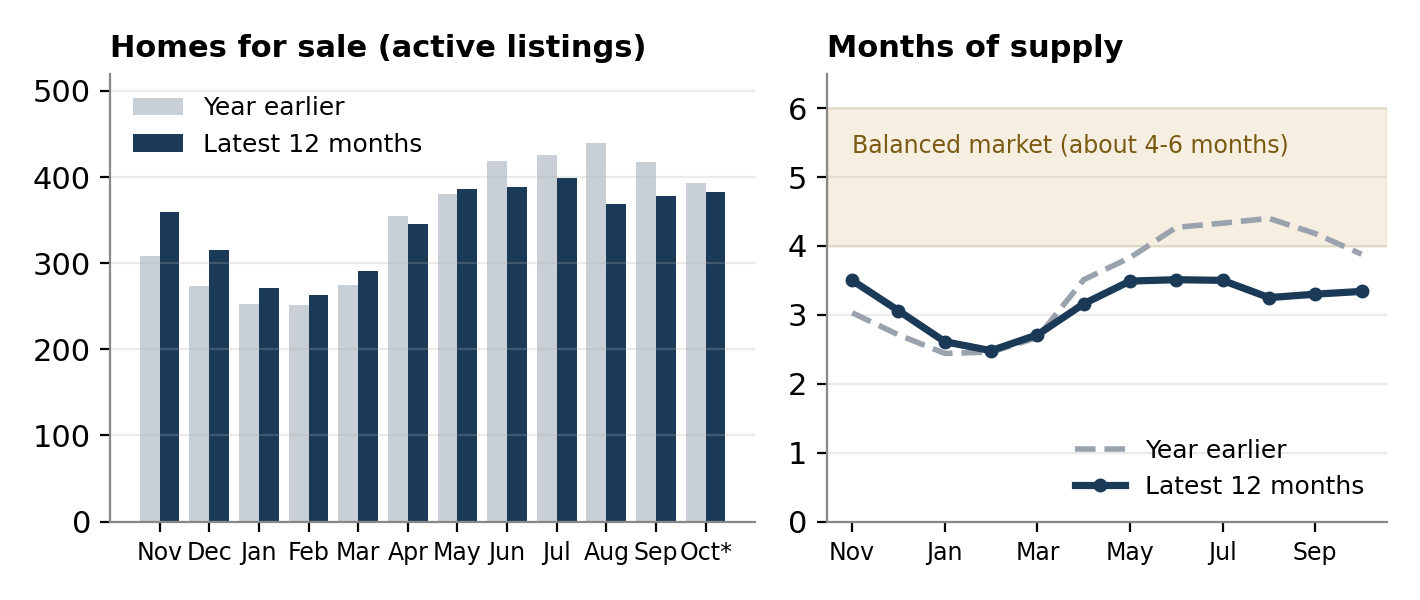
“Months of supply” answers one question: if no new homes came on the market, how long would it take to sell everything currently listed at today's pace? A common rule of thumb is that 4 to 6 months is a balanced market, under 4 leans toward sellers, and over 6 leans toward buyers. Redding sits at 3.3 months, down from 3.9 a year ago. In September there were about 10% fewer homes for sale than the year before, and more homes closed over the past eleven months than in the same period a year earlier.
Oct. is month-to-date through Oct. 23.
What it means for you
With fewer competing listings, a well-prepared home stands out more. Supply is not scarce, though. Buyers still have choices, so condition and price matter. Inventory also tends to build each spring, which brings more competition.
INDICATOR 3 OF 5
Days on Market: How Long Homes Take
Original chart from the guide
What is happening
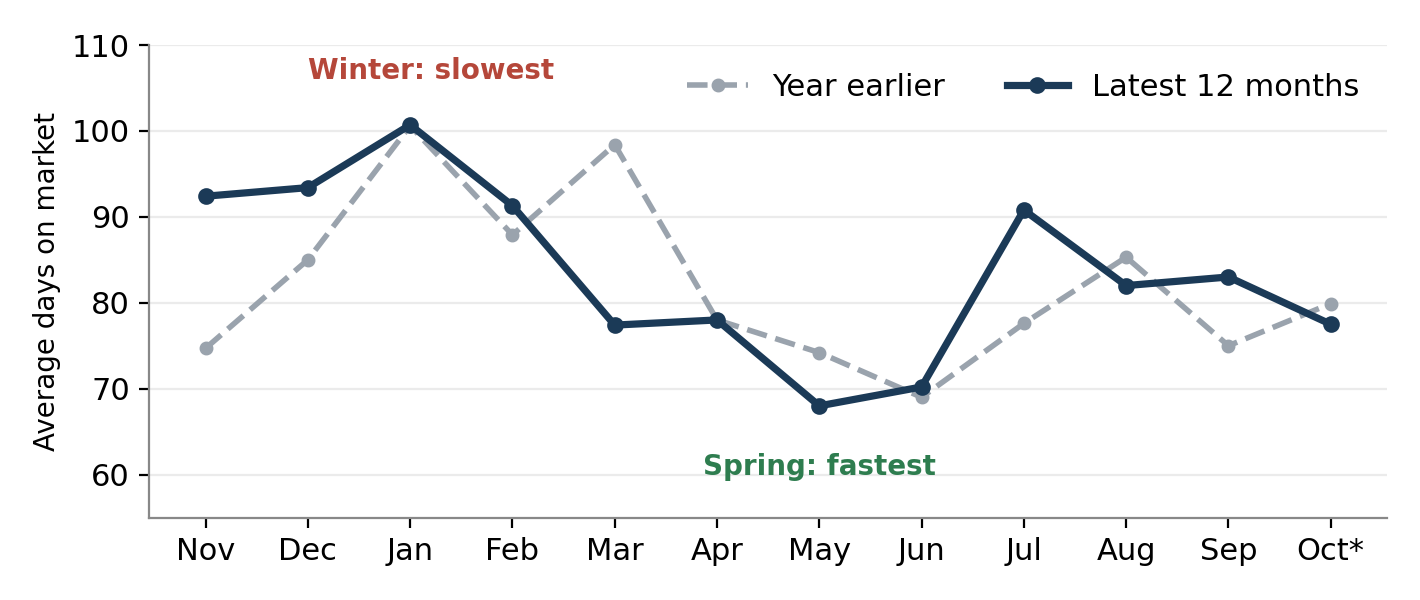
Homes in Redding are taking about two and a half months, on average, from listing to sale. That is nearly identical to a year ago, so the pace has not sped up or slowed down. The big story is the season. Homes sold in May and June averaged roughly 68 to 70 days. Homes sold in January averaged about 100.
What it means for you
Selling in under three months is realistic, but not instant. If you list now, expect a slower stretch through the holidays and winter. If your timeline allows, listing in late winter to catch the spring buyer season is a legitimate option. If you can't wait, pricing correctly from day one matters most, because the first few weeks bring the most attention.
INDICATOR 4 OF 5
Sale Price vs. List Price: Who Has Leverage
Original chart from the guide
What is happening
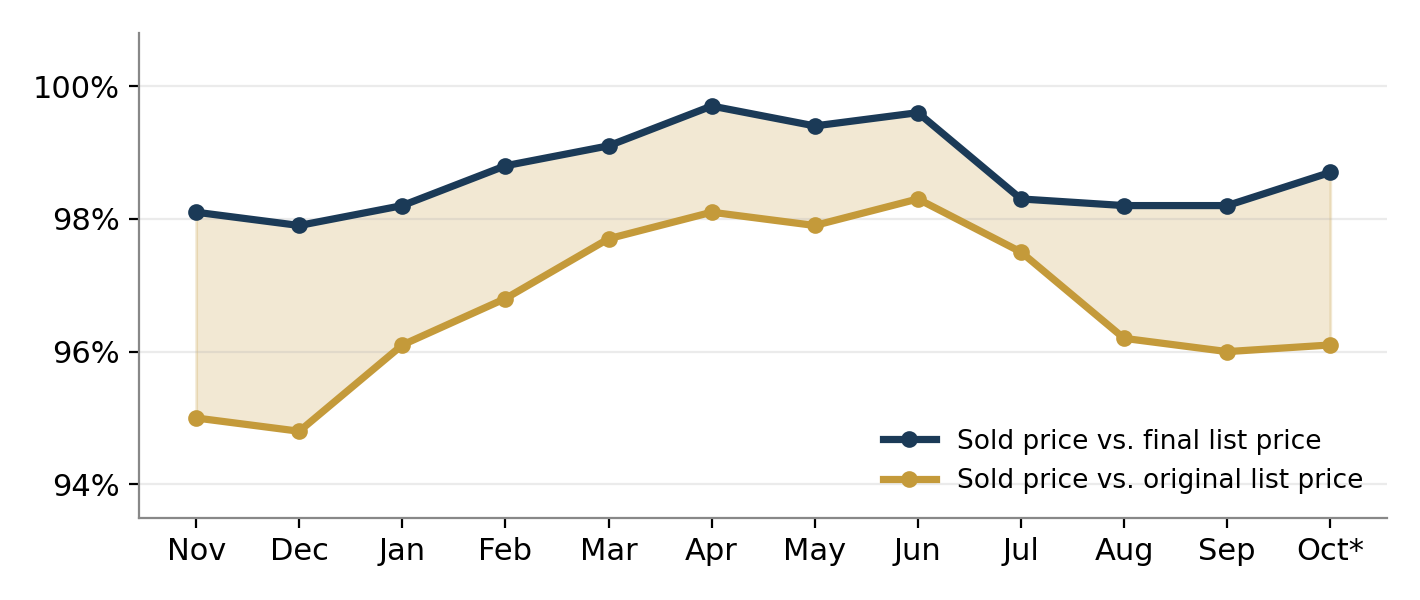
Two numbers tell the story. Homes are selling for about 98.7% of their final list price, but only about 96.1% of their original list price. The difference of roughly 2.6 points is the price reductions and negotiations that happen along the way. Both figures are a bit above this time last year, which gives sellers some leverage. Even so, the original-price figure has slipped from about 98% in the spring, so buyers have regained some negotiating room.
What it means for you
A home priced accurately at the start tends to sell closer to its asking price and with fewer reductions. A home priced too high usually ends up cutting its price anyway, after weeks of lost momentum. That is why we start every listing with a detailed comparison of recent nearby sales.
INDICATOR 5 OF 5
Local Home Prices: Steady, Not Surging
Original chart from the guide
What is happening
Redding prices are holding steady compared with a year ago, but they are not climbing quickly. Averaging the monthly median sold prices from January through September, 2026 is about 0.9% higher than the same months of 2025 (roughly $400,700 vs. $397,200). Month to month, medians bounce around because they depend on which homes happened to sell, so the trend matters more than any one month.
Keep in mind that a median is the middle of the market. Your home's value depends on its size, condition, location and the closest comparable sales, which can differ a lot from the citywide figure.
What it means for you
Stable prices mean you are not racing a falling market, but you are also not waiting on a boom. The question to ask is what your own home would sell for now, which a local price review can answer.
YOUR NEXT STEP
The Market Is Only Half the Decision
Even in a good market, the right time to sell is personal. Here are six questions worth talking through with family, and with us.
- Where will you live next, and is the timing right to make that move?
- Is the home getting harder to maintain, or does it no longer fit your life?
- Do repairs or deferred maintenance worry you? Many homes sell as-is, and you do not have to remodel to sell.
- Is the home held in a trust or an estate? Who has the authority to sign, and what do the trustee or attorney need to see?
- Could your timeline be flexible, such as waiting for spring, or do you need to move sooner?
- Have you talked with your CPA or attorney about taxes and your plans?
How We Help
We specialize in helping senior homeowners, trustees and families through the sale of a home, often during a major life change. As Seniors Real Estate Specialists, we take it one step at a time and explain every decision in plain language. We personally answer every showing call, so we can tell buyers about what makes your home special.
Get a free Home Value & Timing Review
No pressure and no obligation. We will walk through what your home would likely sell for today, what to expect on timing, and your options.
What's Your Home Worth?
Get a free, no-obligation Comparative Market Analysis (CMA) from Shasta County's trusted husband-and-wife team. We'll analyze recent sales, market trends, and your home's unique features to give you an accurate valuation.
Pricing your home right from the start is the single most important factor in selling quickly and for top dollar. Our CMA ensures you have the data to make confident decisions.
Frequently Asked Questions
Is now a good time to sell a home in Redding?
Conditions are still favorable for a home that is priced right, but mortgage rates are moving against sellers. Months of supply is 3.3 (vs. 3.9 a year ago) and the median sold price in September was $393,200 (vs. $391,250), while the 30-year rate is 7.40%, its highest since early 2025.
What are mortgage rates right now?
The Freddie Mac weekly average 30-year fixed rate was 7.40% as of Oct. 15, 2026, up from about 6.3% a year ago. On a $450,000 home with 20% down, that is about $260 more per month in principal and interest.
How long does it take to sell a home in Redding?
Homes averaged 78 days on market in October so far, vs. 80 a year ago. The 12-month average is 84 days (about 12 weeks). May was fastest at 68 days and January slowest at 101.
Do Redding homes sell for asking price?
Homes are selling for about 98.7% of their final list price and about 96.1% of their original list price, both a bit above a year ago (97.5% and 95.0%).
What is the median home price in Redding?
The median sold price in September 2026 was $393,200 vs. $391,250 a year ago. The median asking price in October is $450,000 vs. $442,500 a year ago.
Do I have to remodel before selling?
No. Many homes sell as-is, and you do not have to remodel to sell.


Wayne and Fredericka (Freddie) Martin, Broker Associates
Wayne: 530-355-5805 | Freddie: 530-355-5806
Thinking Of Buying Or Selling... When You're Ready, Call Wayne & Freddie, You'll Be Glad You Did.